
В Python данные из файла Excel считываются в объект DataFrame. Для этого используется функция read_excel() модуля pandas.
Лист Excel — это двухмерная таблица. Объект DataFrame также представляет собой двухмерную табличную структуру данных.
- Пример использования Pandas read_excel()
- Список заголовков столбцов листа Excel
- Вывод данных столбца
- Пример использования Pandas to Excel: read_excel()
- Чтение файла Excel без строки заголовка
- Лист Excel в Dict, CSV и JSON
- Ресурсы

Предположим, что у нас есть документ Excel, состоящий из двух листов: «Employees» и «Cars». Верхняя строка содержит заголовок таблицы.

Ниже приведен код, который считывает данные листа «Employees» и выводит их.
import pandas

excel_data_df = pandas.read_excel('records.xlsx', sheet_name='Employees')

# print whole sheet data
print(excel_data_df)
Вывод:
   EmpID    EmpName EmpRole
0      1     Pankaj     CEO
1      2  David Lee  Editor
2      3   Lisa Ray  Author
Первый параметр, который принимает функция read_excel ()— это имя файла Excel. Второй параметр (sheet_name) определяет лист для считывания данных.
При выводе содержимого объекта DataFrame мы получаем двухмерные таблицы, схожие по своей структуре со структурой документа Excel.
Чтобы получить список заголовков столбцов таблицы, используется свойство columns объекта Dataframe. Пример реализации:
print(excel_data_df.columns.ravel())
Вывод:
['Pankaj', 'David Lee', 'Lisa Ray']
Мы можем получить данные из столбца и преобразовать их в список значений. Пример:
print(excel_data_df['EmpName'].tolist())
Вывод:
['Pankaj', 'David Lee', 'Lisa Ray']
Можно указать имена столбцов для чтения из файла Excel. Это потребуется, если нужно вывести данные из определенных столбцов таблицы.
import pandas

excel_data_df = pandas.read_excel('records.xlsx', sheet_name='Cars', usecols=['Car Name', 'Car Price'])
print(excel_data_df)
Вывод:
         Car Name      Car Price
0      Honda City     20,000 USD
1  Bugatti Chiron  3 Million USD
2     Ferrari 458   2,30,000 USD
Если в листе Excel нет строки заголовка, нужно передать его значение как None.
excel_data_df = pandas.read_excel('records.xlsx', sheet_name='Numbers', header=None)
Если вы передадите значение заголовка как целое число (например, 3), тогда третья строка станет им. При этом считывание данных начнется со следующей строки. Данные, расположенные перед строкой заголовка, будут отброшены.
Объект DataFrame предоставляет различные методы для преобразования табличных данных в формат Dict , CSV или JSON.
excel_data_df = pandas.read_excel('records.xlsx', sheet_name='Cars', usecols=['Car Name', 'Car Price'])

print('Excel Sheet to Dict:', excel_data_df.to_dict(orient='record'))
print('Excel Sheet to JSON:', excel_data_df.to_json(orient='records'))
print('Excel Sheet to CSV:n', excel_data_df.to_csv(index=False))
Вывод:
Excel Sheet to Dict: [{'Car Name': 'Honda City', 'Car Price': '20,000 USD'}, {'Car Name': 'Bugatti Chiron', 'Car Price': '3 Million USD'}, {'Car Name': 'Ferrari 458', 'Car Price': '2,30,000 USD'}]
Excel Sheet to JSON: [{"Car Name":"Honda City","Car Price":"20,000 USD"},{"Car Name":"Bugatti Chiron","Car Price":"3 Million USD"},{"Car Name":"Ferrari 458","Car Price":"2,30,000 USD"}]
Excel Sheet to CSV:
 Car Name,Car Price
Honda City,"20,000 USD"
Bugatti Chiron,3 Million USD
Ferrari 458,"2,30,000 USD"
- Документы API pandas read_excel()
Хотя многие Data Scientist’ы больше привыкли работать с CSV-файлами, на практике очень часто приходится сталкиваться с обычными Excel-таблицами. Поэтому сегодня мы расскажем, как читать Excel-файлы в Pandas, а также рассмотрим основные возможности Python-библиотеки OpenPyXL для чтения метаданных ячеек.
Дополнительные зависимости для возможности чтения Excel таблиц
Для чтения таблиц Excel в Pandas требуются дополнительные зависимости:
- xlrd поддерживает старые и новые форматы MS Excel [1];
- OpenPyXL поддерживает новые форматы MS Excel (.xlsx) [2];
- ODFpy поддерживает свободные форматы OpenDocument (.odf, .ods и .odt) [3];
- pyxlsb поддерживает бинарные MS Excel файлы (формат .xlsb) [4].
Мы рекомендуем установить только OpenPyXL, поскольку он нам пригодится в дальнейшем. Для этого в командной строке прописывается следующая операция:
pip install openpyxl
Затем в Pandas нужно указать путь к Excel-файлу и одну из установленных зависимостей. Python-код выглядит следующим образом:
import pandas as pd
pd.read_excel(io='temp1.xlsx', engine='openpyxl')
#
     Name  Age  Weight
0    Alex   35      87
1   Lesha   57      72
2  Nastya   21      64
Читаем несколько листов
Excel-файл может содержать несколько листов. В Pandas, чтобы прочитать конкретный лист, в аргументе нужно указать sheet_name. Можно указать список названий листов, тогда Pandas вернет словарь (dict) с объектами DataFrame:
dfs = pd.read_excel(io='temp1.xlsx',
                    engine='openpyxl',
                    sheet_name=['Sheet1', 'Sheet2'])
dfs
#
{'Sheet1':      Name  Age  Weight
 0    Alex   35      87
 1   Lesha   57      72
 2  Nastya   21      64,
 'Sheet2':     Name  Age  Weight
 0  Gosha   43      95
 1   Anna   24      65
 2   Lena   22      78}
Если таблицы в словаре имеют одинаковые атрибуты, то их можно объединить в один DataFrame. В Python это выглядит так:
pd.concat(dfs).reset_index(drop=True)
     Name  Age  Weight
0    Alex   35      87
1   Lesha   57      72
2  Nastya   21      64
3   Gosha   43      95
4    Anna   24      65
5    Lena   22      78
Указание диапазонов
Таблицы могут размещаться не в самом начале, а как, например, на рисунке ниже. Как видим, таблица располагается в диапазоне A:F.
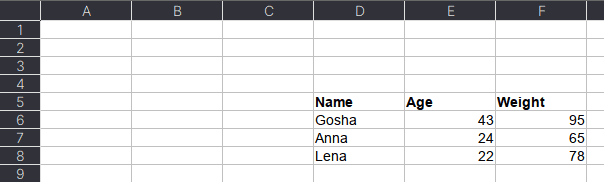
Чтобы прочитать такую таблицу, нужно указать диапазон в аргументе usecols. Также дополнительно можно добавить header — номер заголовка таблицы, а также nrows — количество строк, которые нужно прочитать. В аргументе header всегда передается номер строки на единицу меньше, чем в Excel-файле, поскольку в Python индексация начинается с 0 (на рисунке это номер 5, тогда указываем 4):
pd.read_excel(io='temp1.xlsx',
              engine='openpyxl',
              usecols='D:F',
              header=4, # в excel это №5
              nrows=3)
#
    Name  Age  Weight
0  Gosha   43      95
1   Anna   24      65
2   Lena   22      78
Читаем таблицы в OpenPyXL
Pandas прочитывает только содержимое таблицы, но игнорирует метаданные: цвет заливки ячеек, примечания, стили таблицы и т.д. В таком случае пригодится библиотека OpenPyXL. Загрузка файлов осуществляется через функцию load_workbook, а к листам обращаться можно через квадратные скобки:
from openpyxl import load_workbook
wb = load_workbook('temp2.xlsx')
ws = wb['Лист1']
type(ws)
# openpyxl.worksheet.worksheet.Worksheet
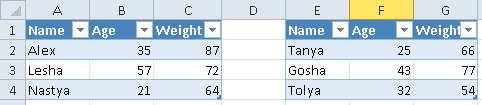
Допустим, имеется Excel-файл с несколькими таблицами на листе (см. рисунок выше). Если бы мы использовали Pandas, то он бы выдал следующий результат:
pd.read_excel(io='temp2.xlsx',
              engine='openpyxl')
#
     Name  Age  Weight  Unnamed: 3 Name.1  Age.1  Weight.1
0    Alex   35      87         NaN  Tanya     25        66
1   Lesha   57      72         NaN  Gosha     43        77
2  Nastya   21      64         NaN  Tolya     32        54
Можно, конечно, заняться обработкой и привести таблицы в нормальный вид, а можно воспользоваться OpenPyXL, который хранит таблицу и его диапазон в словаре. Чтобы посмотреть этот словарь, нужно вызвать ws.tables.items. Вот так выглядит Python-код:
ws.tables.items()
wb = load_workbook('temp2.xlsx')
ws = wb['Лист1']
ws.tables.items()
#
[('Таблица1', 'A1:C4'), ('Таблица13', 'E1:G4')]
Обращаясь к каждому диапазону, можно проходить по каждой строке или столбцу, а внутри них – по каждой ячейке. Например, следующий код на Python таблицы объединяет строки в список, где первая строка уходит на заголовок, а затем преобразует их в DataFrame:
dfs = []
for table_name, value in ws.tables.items():
    table = ws[value]
    header, *body = [[cell.value for cell in row]
                      for row in table]
    df = pd.DataFrame(body, columns=header)
    dfs.append(df)
Если таблицы имеют одинаковые атрибуты, то их можно соединить в одну:
pd.concat(dfs)
#
     Name  Age  Weight
0    Alex   35      87
1   Lesha   57      72
2  Nastya   21      64
0   Tanya   25      66
1   Gosha   43      77
2   Tolya   32      54
Сохраняем метаданные таблицы
Как указано в коде выше, у ячейки OpenPyXL есть атрибут value, который хранит ее значение. Помимо value, можно получить тип ячейки (data_type), цвет заливки (fill), примечание (comment) и др.
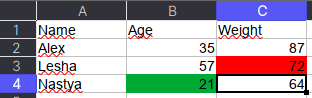
Например, требуется сохранить данные о цвете ячеек. Для этого мы каждую ячейку с числами перезапишем в виде <значение,RGB>, где RGB — значение цвета в формате RGB (red, green, blue). Python-код выглядит следующим образом:
# _TYPES = {int:'n', float:'n', str:'s', bool:'b'}
data = []
for row in ws.rows:
    row_cells = []
    for cell in row:
        cell_value = cell.value
        if cell.data_type == 'n':
            cell_value = f"{cell_value},{cell.fill.fgColor.rgb}"
        row_cells.append(cell_value)
    data.append(row_cells)
Первым элементом списка является строка-заголовок, а все остальное уже значения таблицы:
pd.DataFrame(data[1:], columns=data[0])
#
     Name          Age       Weight
0    Alex  35,00000000  87,00000000
1   Lesha  57,00000000  72,FFFF0000
2  Nastya  21,FF00A933  64,00000000
Теперь представим атрибуты в виде индексов с помощью метода stack, а после разобьём все записи на значение и цвет методом str.split:
(pd.DataFrame(data[1:], columns=data[0])
 .set_index('Name')
 .stack()
 .str.split(',', expand=True)
)
#
                0         1
Name
Alex   Age     35  00000000
       Weight  87  00000000
Lesha  Age     57  00000000
       Weight  72  FFFF0000
Nastya Age     21  FF00A933
       Weight  64  0000000
Осталось только переименовать 0 и 1 на Value и Color, а также добавить атрибут Variable, который обозначит Вес и Возраст. Полный код на Python выглядит следующим образом:
(pd.DataFrame(data[1:], columns=data[0])
 .set_index('Name')
 .stack()
 .str.split(',', expand=True)
 .set_axis(['Value', 'Color'], axis=1)
 .rename_axis(index=['Name', 'Variable'])
 .reset_index()
)
#
     Name Variable Value     Color
0    Alex      Age    35  00000000
1    Alex   Weight    87  00000000
2   Lesha      Age    57  00000000
3   Lesha   Weight    72  FFFF0000
4  Nastya      Age    21  FF00A933
5  Nastya   Weight    64  00000000
Ещё больше подробностей о работе с таблицами в Pandas, а также их обработке на реальных примерах Data Science задач, вы узнаете на наших курсах по Python в лицензированном учебном центре обучения и повышения квалификации IT-специалистов в Москве.
Источники
- https://xlrd.readthedocs.io/en/latest/
- https://openpyxl.readthedocs.io/en/latest/
- https://github.com/eea/odfpy
- https://github.com/willtrnr/pyxlsb
The read_excel() method can read Excel 2003 (.xls) and
Excel 2007+ (.xlsx) files using the xlrd Python
module. The to_excel() instance method is used for
saving a DataFrame to Excel. Generally the semantics are
similar to working with csv data. See the cookbook for some
advanced strategies
10.5.1 Reading Excel Files
In the most basic use-case, read_excel takes a path to an Excel
file, and the sheetname indicating which sheet to parse.
# Returns a DataFrame
read_excel('path_to_file.xls', sheetname='Sheet1')
10.5.1.1 ExcelFile class
To facilitate working with multiple sheets from the same file, the ExcelFile
class can be used to wrap the file and can be be passed into read_excel
There will be a performance benefit for reading multiple sheets as the file is
read into memory only once.
xlsx = pd.ExcelFile('path_to_file.xls)
df = pd.read_excel(xlsx, 'Sheet1')
The ExcelFile class can also be used as a context manager.
with pd.ExcelFile('path_to_file.xls') as xls:
    df1 = pd.read_excel(xls, 'Sheet1')
    df2 = pd.read_excel(xls, 'Sheet2')
The sheet_names property will generate
a list of the sheet names in the file.
The primary use-case for an ExcelFile is parsing multiple sheets with
different parameters
data = {}
# For when Sheet1's format differs from Sheet2
with pd.ExcelFile('path_to_file.xls') as xls:
    data['Sheet1'] = pd.read_excel(xls, 'Sheet1', index_col=None, na_values=['NA'])
    data['Sheet2'] = pd.read_excel(xls, 'Sheet2', index_col=1)
Note that if the same parsing parameters are used for all sheets, a list
of sheet names can simply be passed to read_excel with no loss in performance.
# using the ExcelFile class
data = {}
with pd.ExcelFile('path_to_file.xls') as xls:
    data['Sheet1'] = read_excel(xls, 'Sheet1', index_col=None, na_values=['NA'])
    data['Sheet2'] = read_excel(xls, 'Sheet2', index_col=None, na_values=['NA'])

# equivalent using the read_excel function
data = read_excel('path_to_file.xls', ['Sheet1', 'Sheet2'], index_col=None, na_values=['NA'])
New in version 0.12.
ExcelFile has been moved to the top level namespace.
New in version 0.17.
read_excel can take an ExcelFile object as input
10.5.1.2 Specifying Sheets
Note
The second argument is sheetname, not to be confused with ExcelFile.sheet_names
Note
An ExcelFile’s attribute sheet_names provides access to a list of sheets.
- The arguments
sheetnameallows specifying the sheet or sheets to read. - The default value for
sheetnameis 0, indicating to read the first sheet - Pass a string to refer to the name of a particular sheet in the workbook.
- Pass an integer to refer to the index of a sheet. Indices follow Python
convention, beginning at 0. - Pass a list of either strings or integers, to return a dictionary of specified sheets.
- Pass a
Noneto return a dictionary of all available sheets.
# Returns a DataFrame
read_excel('path_to_file.xls', 'Sheet1', index_col=None, na_values=['NA'])
Using the sheet index:
# Returns a DataFrame
read_excel('path_to_file.xls', 0, index_col=None, na_values=['NA'])
Using all default values:
# Returns a DataFrame
read_excel('path_to_file.xls')
Using None to get all sheets:
# Returns a dictionary of DataFrames
read_excel('path_to_file.xls',sheetname=None)
Using a list to get multiple sheets:
# Returns the 1st and 4th sheet, as a dictionary of DataFrames.
read_excel('path_to_file.xls',sheetname=['Sheet1',3])
New in version 0.16.
read_excel can read more than one sheet, by setting sheetname to either
a list of sheet names, a list of sheet positions, or None to read all sheets.
New in version 0.13.
Sheets can be specified by sheet index or sheet name, using an integer or string,
respectively.
10.5.1.3 Reading a MultiIndex
New in version 0.17.
read_excel can read a MultiIndex index, by passing a list of columns to index_col
and a MultiIndex column by passing a list of rows to header. If either the index
or columns have serialized level names those will be read in as well by specifying
the rows/columns that make up the levels.
For example, to read in a MultiIndex index without names:
In [1]: df = pd.DataFrame({'a':[1,2,3,4], 'b':[5,6,7,8]},
   ...:                   index=pd.MultiIndex.from_product([['a','b'],['c','d']]))
   ...:

In [2]: df.to_excel('path_to_file.xlsx')

In [3]: df = pd.read_excel('path_to_file.xlsx', index_col=[0,1])

In [4]: df
Out[4]:
     a  b
a c  1  5
  d  2  6
b c  3  7
  d  4  8
If the index has level names, they will parsed as well, using the same
parameters.
In [5]: df.index = df.index.set_names(['lvl1', 'lvl2'])

In [6]: df.to_excel('path_to_file.xlsx')

In [7]: df = pd.read_excel('path_to_file.xlsx', index_col=[0,1])

In [8]: df
Out[8]:
           a  b
lvl1 lvl2
a    c     1  5
     d     2  6
b    c     3  7
     d     4  8
If the source file has both MultiIndex index and columns, lists specifying each
should be passed to index_col and header
In [9]: df.columns = pd.MultiIndex.from_product([['a'],['b', 'd']], names=['c1', 'c2'])

In [10]: df.to_excel('path_to_file.xlsx')

In [11]: df = pd.read_excel('path_to_file.xlsx',
   ....:                     index_col=[0,1], header=[0,1])
   ....:

In [12]: df
Out[12]:
c1         a
c2         b  d
lvl1 lvl2
a    c     1  5
     d     2  6
b    c     3  7
     d     4  8
Warning
Excel files saved in version 0.16.2 or prior that had index names will still able to be read in,
but the has_index_names argument must specified to True.
10.5.1.4 Parsing Specific Columns
It is often the case that users will insert columns to do temporary computations
in Excel and you may not want to read in those columns. read_excel takes
a parse_cols keyword to allow you to specify a subset of columns to parse.
If parse_cols is an integer, then it is assumed to indicate the last column
to be parsed.
read_excel('path_to_file.xls', 'Sheet1', parse_cols=2)
If parse_cols is a list of integers, then it is assumed to be the file column
indices to be parsed.
read_excel('path_to_file.xls', 'Sheet1', parse_cols=[0, 2, 3])
10.5.1.5 Cell Converters
It is possible to transform the contents of Excel cells via the converters
option. For instance, to convert a column to boolean:
read_excel('path_to_file.xls', 'Sheet1', converters={'MyBools': bool})
This options handles missing values and treats exceptions in the converters
as missing data. Transformations are applied cell by cell rather than to the
column as a whole, so the array dtype is not guaranteed. For instance, a
column of integers with missing values cannot be transformed to an array
with integer dtype, because NaN is strictly a float. You can manually mask
missing data to recover integer dtype:
cfun = lambda x: int(x) if x else -1
read_excel('path_to_file.xls', 'Sheet1', converters={'MyInts': cfun})
10.5.2 Writing Excel Files
10.5.2.1 Writing Excel Files to Disk
To write a DataFrame object to a sheet of an Excel file, you can use the
to_excel instance method. The arguments are largely the same as to_csv
described above, the first argument being the name of the excel file, and the
optional second argument the name of the sheet to which the DataFrame should be
written. For example:
df.to_excel('path_to_file.xlsx', sheet_name='Sheet1')
Files with a .xls extension will be written using xlwt and those with a
.xlsx extension will be written using xlsxwriter (if available) or
openpyxl.
The DataFrame will be written in a way that tries to mimic the REPL output. One
difference from 0.12.0 is that the index_label will be placed in the second
row instead of the first. You can get the previous behaviour by setting the
merge_cells option in to_excel() to False:
df.to_excel('path_to_file.xlsx', index_label='label', merge_cells=False)
The Panel class also has a to_excel instance method,
which writes each DataFrame in the Panel to a separate sheet.
In order to write separate DataFrames to separate sheets in a single Excel file,
one can pass an ExcelWriter.
with ExcelWriter('path_to_file.xlsx') as writer:
    df1.to_excel(writer, sheet_name='Sheet1')
    df2.to_excel(writer, sheet_name='Sheet2')
Note
Wringing a little more performance out of read_excel
Internally, Excel stores all numeric data as floats. Because this can
produce unexpected behavior when reading in data, pandas defaults to trying
to convert integers to floats if it doesn’t lose information (1.0 -->). You can pass
1convert_float=False to disable this behavior, which
may give a slight performance improvement.
10.5.2.2 Writing Excel Files to Memory
New in version 0.17.
Pandas supports writing Excel files to buffer-like objects such as StringIO or
BytesIO using ExcelWriter.
New in version 0.17.
Added support for Openpyxl >= 2.2
# Safe import for either Python 2.x or 3.x
try:
    from io import BytesIO
except ImportError:
    from cStringIO import StringIO as BytesIO

bio = BytesIO()

# By setting the 'engine' in the ExcelWriter constructor.
writer = ExcelWriter(bio, engine='xlsxwriter')
df.to_excel(writer, sheet_name='Sheet1')

# Save the workbook
writer.save()

# Seek to the beginning and read to copy the workbook to a variable in memory
bio.seek(0)
workbook = bio.read()
Note
engine is optional but recommended. Setting the engine determines
the version of workbook produced. Setting engine='xlrd' will produce an
Excel 2003-format workbook (xls). Using either 'openpyxl' or
'xlsxwriter' will produce an Excel 2007-format workbook (xlsx). If
omitted, an Excel 2007-formatted workbook is produced.
10.5.3 Excel writer engines
New in version 0.13.
pandas chooses an Excel writer via two methods:
- the
enginekeyword argument - the filename extension (via the default specified in config options)
By default, pandas uses the XlsxWriter for .xlsx and openpyxl
for .xlsm files and xlwt for .xls files. If you have multiple
engines installed, you can set the default engine through setting the
config options io.excel.xlsx.writer and
io.excel.xls.writer. pandas will fall back on openpyxl for .xlsx
files if Xlsxwriter is not available.
To specify which writer you want to use, you can pass an engine keyword
argument to to_excel and to ExcelWriter. The built-in engines are:
openpyxl: This includes stable support for Openpyxl from 1.6.1. However,
it is advised to use version 2.2 and higher, especially when working with
styles.xlsxwriterxlwt
# By setting the 'engine' in the DataFrame and Panel 'to_excel()' methods.
df.to_excel('path_to_file.xlsx', sheet_name='Sheet1', engine='xlsxwriter')

# By setting the 'engine' in the ExcelWriter constructor.
writer = ExcelWriter('path_to_file.xlsx', engine='xlsxwriter')

# Or via pandas configuration.
from pandas import options
options.io.excel.xlsx.writer = 'xlsxwriter'

df.to_excel('path_to_file.xlsx', sheet_name='Sheet1')
Excel sheets are very instinctive and user-friendly, which makes them ideal for manipulating large datasets even for less technical folks. If you are looking for places to learn to manipulate and automate stuff in excel files using Python, look no more. You are at the right place.
Python Pandas With Excel Sheet
In this article, you will learn how to use Pandas to work with Excel spreadsheets. At the end of the article, you will have the knowledge of:
- Necessary modules are needed for this and how to set them up in your system.
- Reading data from excel files into pandas using Python.
- Exploring the data from excel files in Pandas.
- Using functions to manipulate and reshape the data in Pandas.
Installation
To install Pandas in Anaconda, we can use the following command in Anaconda Terminal:
conda install pandas
To install Pandas in regular Python (Non-Anaconda), we can use the following command in the command prompt:
pip install pandas
Getting Started
First of all, we need to import the Pandas module which can be done by running the command: Pandas
Python3
Input File: Let’s suppose the excel file looks like this
Sheet 1:
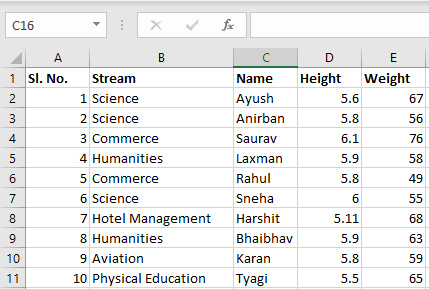
Sheet 2:
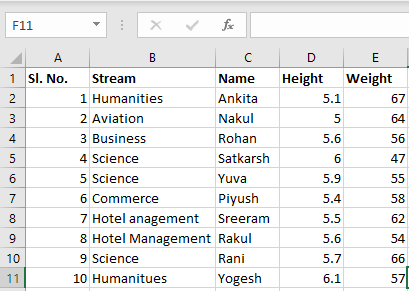
Now we can import the excel file using the read_excel function in Pandas. The second statement reads the data from excel and stores it into a pandas Data Frame which is represented by the variable newData. If there are multiple sheets in the excel workbook, the command will import data of the first sheet. To make a data frame with all the sheets in the workbook, the easiest method is to create different data frames separately and then concatenate them. The read_excel method takes argument sheet_name and index_col where we can specify the sheet of which the data frame should be made of and index_col specifies the title column, as is shown below:
Python3
file =('path_of_excel_file')
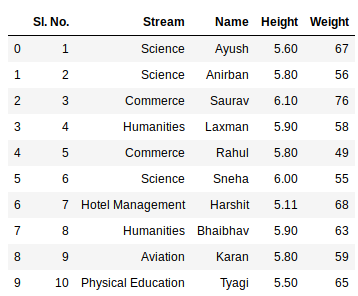
newData = pds.read_excel(file)
newData
Output:
Example:
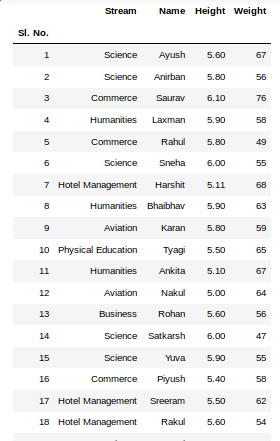
The third statement concatenates both sheets. Now to check the whole data frame, we can simply run the following command:
Python3
sheet1 = pds.read_excel(file,
sheet_name = 0,
index_col = 0)
sheet2 = pds.read_excel(file,
sheet_name = 1,
index_col = 0)
newData = pds.concat([sheet1, sheet2])
newData
Output:
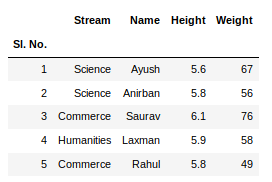
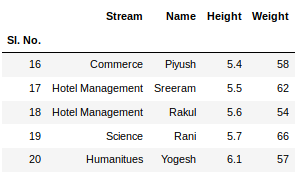
To view 5 columns from the top and from the bottom of the data frame, we can run the command. This head() and tail() method also take arguments as numbers for the number of columns to show.
Python3
newData.head()
newData.tail()
Output:
The shape() method can be used to view the number of rows and columns in the data frame as follows:
Python3
Output:

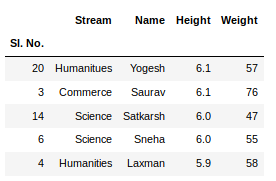
If any column contains numerical data, we can sort that column using the sort_values() method in pandas as follows:
Python3
sorted_column = newData.sort_values(['Height'], ascending = False)
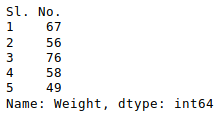
Now, let’s suppose we want the top 5 values of the sorted column, we can use the head() method here:
Python3
sorted_column['Height'].head(5)
Output:
We can do that with any numerical column of the data frame as shown below:
Python3
Output:
Now, suppose our data is mostly numerical. We can get the statistical information like mean, max, min, etc. about the data frame using the describe() method as shown below:
Python3
Output:
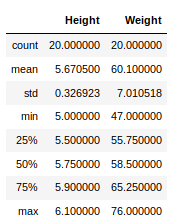
This can also be done separately for all the numerical columns using the following command:
Python3
Output:

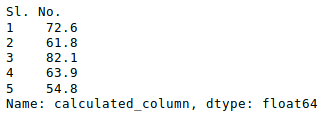
Other statistical information can also be calculated using the respective methods. Like in excel, formulas can also be applied and calculated columns can be created as follows:
Python3
newData['calculated_column'] =
newData[“Height”] + newData[“Weight”]
newData['calculated_column'].head()
Output:
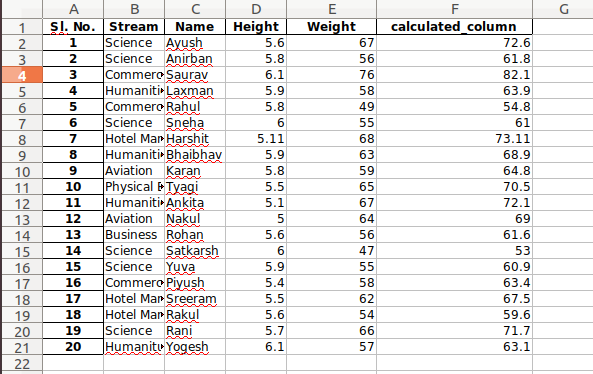
After operating on the data in the data frame, we can export the data back to an excel file using the method to_excel. For this we need to specify an output excel file where the transformed data is to be written, as shown below:
Python3
newData.to_excel('Output File.xlsx')
Output:
Microsoft Excel is one of the most powerful spreadsheet software applications in the world, and it has become critical in all business processes. Companies across the world, both big and small, are using Microsoft Excel to store, organize, analyze, and visualize data.
As a data professional, when you combine Python with Excel, you create a unique data analysis bundle that unlocks the value of the enterprise data.
In this tutorial, we’re going to learn how to read and work with Excel files in Python.
After you finish this tutorial, you’ll understand the following:
- Loading Excel spreadsheets into pandas DataFrames
- Working with an Excel workbook with multiple spreadsheets
- Combining multiple spreadsheets
- Reading Excel files using the
xlrdpackage
In this tutorial, we assume you know the fundamentals of pandas DataFrames. If you aren’t familiar with the pandas library, you might like to try our Pandas and NumPy Fundamentals – Dataquest.
Let’s dive in.
Reading Spreadsheets with Pandas
Technically, multiple packages allow us to work with Excel files in Python. However, in this tutorial, we’ll use pandas and xlrd libraries to interact with Excel workbooks. Essentially, you can think of a pandas DataFrame as a spreadsheet with rows and columns stored in Series objects. Traversability of Series as iterable objects allows us to grab specific data easily. Once we load an Excel workbook into a pandas DataFrame, we can perform any kind of data analysis on the data.
Before we proceed to the next step, let’s first download the following spreadsheet:
Sales Data Excel Workbook — xlsx ver.
The Excel workbook consists of two sheets that contain stationery sales data for 2020 and 2021.
NOTE
Although Excel spreadsheets can contain formula and also support formatting, pandas only imports Excel spreadsheets as flat files, and it doesn’t support spreadsheet formatting.
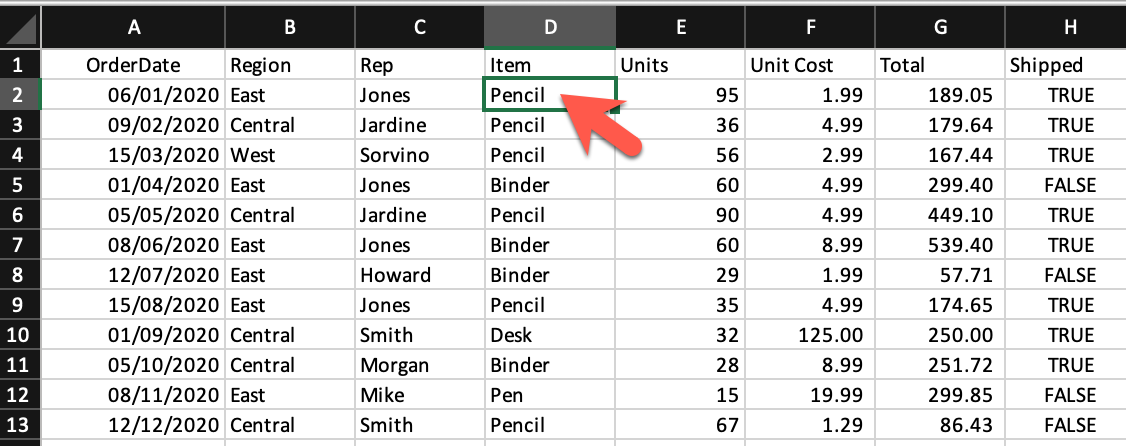
To import the Excel spreadsheet into a pandas DataFrame, first, we need to import the pandas package and then use the read_excel() method:
import pandas as pd
df = pd.read_excel('sales_data.xlsx')

display(df)| OrderDate | Region | Rep | Item | Units | Unit Cost | Total | Shipped | |
|---|---|---|---|---|---|---|---|---|
| 0 | 2020-01-06 | East | Jones | Pencil | 95 | 1.99 | 189.05 | True |
| 1 | 2020-02-09 | Central | Jardine | Pencil | 36 | 4.99 | 179.64 | True |
| 2 | 2020-03-15 | West | Sorvino | Pencil | 56 | 2.99 | 167.44 | True |
| 3 | 2020-04-01 | East | Jones | Binder | 60 | 4.99 | 299.40 | False |
| 4 | 2020-05-05 | Central | Jardine | Pencil | 90 | 4.99 | 449.10 | True |
| 5 | 2020-06-08 | East | Jones | Binder | 60 | 8.99 | 539.40 | True |
| 6 | 2020-07-12 | East | Howard | Binder | 29 | 1.99 | 57.71 | False |
| 7 | 2020-08-15 | East | Jones | Pencil | 35 | 4.99 | 174.65 | True |
| 8 | 2020-09-01 | Central | Smith | Desk | 32 | 125.00 | 250.00 | True |
| 9 | 2020-10-05 | Central | Morgan | Binder | 28 | 8.99 | 251.72 | True |
| 10 | 2020-11-08 | East | Mike | Pen | 15 | 19.99 | 299.85 | False |
| 11 | 2020-12-12 | Central | Smith | Pencil | 67 | 1.29 | 86.43 | False |
If you want to load only a limited number of rows into the DataFrame, you can specify the number of rows using the nrows argument:
df = pd.read_excel('sales_data.xlsx', nrows=5)
display(df)| OrderDate | Region | Rep | Item | Units | Unit Cost | Total | Shipped | |
|---|---|---|---|---|---|---|---|---|
| 0 | 2020-01-06 | East | Jones | Pencil | 95 | 1.99 | 189.05 | True |
| 1 | 2020-02-09 | Central | Jardine | Pencil | 36 | 4.99 | 179.64 | True |
| 2 | 2020-03-15 | West | Sorvino | Pencil | 56 | 2.99 | 167.44 | True |
| 3 | 2020-04-01 | East | Jones | Binder | 60 | 4.99 | 299.40 | False |
| 4 | 2020-05-05 | Central | Jardine | Pencil | 90 | 4.99 | 449.10 | True |
Skipping a specific number of rows from the begining of a spreadsheet or skipping over a list of particular rows is available through the skiprows argument, as follows:
df = pd.read_excel('sales_data.xlsx', skiprows=range(5))
display(df)| 2020-05-05 00:00:00 | Central | Jardine | Pencil | 90 | 4.99 | 449.1 | True | |
|---|---|---|---|---|---|---|---|---|
| 0 | 2020-06-08 | East | Jones | Binder | 60 | 8.99 | 539.40 | True |
| 1 | 2020-07-12 | East | Howard | Binder | 29 | 1.99 | 57.71 | False |
| 2 | 2020-08-15 | East | Jones | Pencil | 35 | 4.99 | 174.65 | True |
| 3 | 2020-09-01 | Central | Smith | Desk | 32 | 125.00 | 250.00 | True |
| 4 | 2020-10-05 | Central | Morgan | Binder | 28 | 8.99 | 251.72 | True |
| 5 | 2020-11-08 | East | Mike | Pen | 15 | 19.99 | 299.85 | False |
| 6 | 2020-12-12 | Central | Smith | Pencil | 67 | 1.29 | 86.43 | False |
The code above skips the first five rows and returns the rest of the data. Instead, the following code returns all the rows except for those with the mentioned indices:
df = pd.read_excel('sales_data.xlsx', skiprows=[1, 4,7,10])
display(df)| OrderDate | Region | Rep | Item | Units | Unit Cost | Total | Shipped | |
|---|---|---|---|---|---|---|---|---|
| 0 | 2020-02-09 | Central | Jardine | Pencil | 36 | 4.99 | 179.64 | True |
| 1 | 2020-03-15 | West | Sorvino | Pencil | 56 | 2.99 | 167.44 | True |
| 2 | 2020-05-05 | Central | Jardine | Pencil | 90 | 4.99 | 449.10 | True |
| 3 | 2020-06-08 | East | Jones | Binder | 60 | 8.99 | 539.40 | True |
| 4 | 2020-08-15 | East | Jones | Pencil | 35 | 4.99 | 174.65 | True |
| 5 | 2020-09-01 | Central | Smith | Desk | 32 | 125.00 | 250.00 | True |
| 6 | 2020-11-08 | East | Mike | Pen | 15 | 19.99 | 299.85 | False |
| 7 | 2020-12-12 | Central | Smith | Pencil | 67 | 1.29 | 86.43 | False |
Another useful argument is usecols, which allows us to select spreadsheet columns with their letters, names, or positional numbers. Let’s see how it works:
df = pd.read_excel('sales_data.xlsx', usecols='A:C,G')
display(df)| OrderDate | Region | Rep | Total | |
|---|---|---|---|---|
| 0 | 2020-01-06 | East | Jones | 189.05 |
| 1 | 2020-02-09 | Central | Jardine | 179.64 |
| 2 | 2020-03-15 | West | Sorvino | 167.44 |
| 3 | 2020-04-01 | East | Jones | 299.40 |
| 4 | 2020-05-05 | Central | Jardine | 449.10 |
| 5 | 2020-06-08 | East | Jones | 539.40 |
| 6 | 2020-07-12 | East | Howard | 57.71 |
| 7 | 2020-08-15 | East | Jones | 174.65 |
| 8 | 2020-09-01 | Central | Smith | 250.00 |
| 9 | 2020-10-05 | Central | Morgan | 251.72 |
| 10 | 2020-11-08 | East | Mike | 299.85 |
| 11 | 2020-12-12 | Central | Smith | 86.43 |
In the code above, the string assigned to the usecols argument contains a range of columns with : plus column G separated by a comma. Also, we’re able to provide a list of column names and assign it to the usecols argument, as follows:
df = pd.read_excel('sales_data.xlsx', usecols=['OrderDate', 'Region', 'Rep', 'Total'])
display(df)| OrderDate | Region | Rep | Total | |
|---|---|---|---|---|
| 0 | 2020-01-06 | East | Jones | 189.05 |
| 1 | 2020-02-09 | Central | Jardine | 179.64 |
| 2 | 2020-03-15 | West | Sorvino | 167.44 |
| 3 | 2020-04-01 | East | Jones | 299.40 |
| 4 | 2020-05-05 | Central | Jardine | 449.10 |
| 5 | 2020-06-08 | East | Jones | 539.40 |
| 6 | 2020-07-12 | East | Howard | 57.71 |
| 7 | 2020-08-15 | East | Jones | 174.65 |
| 8 | 2020-09-01 | Central | Smith | 250.00 |
| 9 | 2020-10-05 | Central | Morgan | 251.72 |
| 10 | 2020-11-08 | East | Mike | 299.85 |
| 11 | 2020-12-12 | Central | Smith | 86.43 |
The usecols argument accepts a list of column numbers, too. The following code shows how we can pick up specific columns using their indices:
df = pd.read_excel('sales_data.xlsx', usecols=[0, 1, 2, 6])
display(df)| OrderDate | Region | Rep | Total | |
|---|---|---|---|---|
| 0 | 2020-01-06 | East | Jones | 189.05 |
| 1 | 2020-02-09 | Central | Jardine | 179.64 |
| 2 | 2020-03-15 | West | Sorvino | 167.44 |
| 3 | 2020-04-01 | East | Jones | 299.40 |
| 4 | 2020-05-05 | Central | Jardine | 449.10 |
| 5 | 2020-06-08 | East | Jones | 539.40 |
| 6 | 2020-07-12 | East | Howard | 57.71 |
| 7 | 2020-08-15 | East | Jones | 174.65 |
| 8 | 2020-09-01 | Central | Smith | 250.00 |
| 9 | 2020-10-05 | Central | Morgan | 251.72 |
| 10 | 2020-11-08 | East | Mike | 299.85 |
| 11 | 2020-12-12 | Central | Smith | 86.43 |
Working with Multiple Spreadsheets
Excel files or workbooks usually contain more than one spreadsheet. The pandas library allows us to load data from a specific sheet or combine multiple spreadsheets into a single DataFrame. In this section, we’ll explore how to use these valuable capabilities.
By default, the read_excel() method reads the first Excel sheet with the index 0. However, we can choose the other sheets by assigning a particular sheet name, sheet index, or even a list of sheet names or indices to the sheet_name argument. Let’s try it:
df = pd.read_excel('sales_data.xlsx', sheet_name='2021')
display(df)| OrderDate | Region | Rep | Item | Units | Unit Cost | Total | Shipped | |
|---|---|---|---|---|---|---|---|---|
| 0 | 2021-01-15 | Central | Gill | Binder | 46 | 8.99 | 413.54 | True |
| 1 | 2021-02-01 | Central | Smith | Binder | 87 | 15.00 | 1305.00 | True |
| 2 | 2021-03-07 | West | Sorvino | Binder | 27 | 19.99 | 139.93 | True |
| 3 | 2021-04-10 | Central | Andrews | Pencil | 66 | 1.99 | 131.34 | False |
| 4 | 2021-05-14 | Central | Gill | Pencil | 53 | 1.29 | 68.37 | False |
| 5 | 2021-06-17 | Central | Tom | Desk | 15 | 125.00 | 625.00 | True |
| 6 | 2021-07-04 | East | Jones | Pen Set | 62 | 4.99 | 309.38 | True |
| 7 | 2021-08-07 | Central | Tom | Pen Set | 42 | 23.95 | 1005.90 | True |
| 8 | 2021-09-10 | Central | Gill | Pencil | 47 | 1.29 | 9.03 | True |
| 9 | 2021-10-14 | West | Thompson | Binder | 57 | 19.99 | 1139.43 | False |
| 10 | 2021-11-17 | Central | Jardine | Binder | 11 | 4.99 | 54.89 | False |
| 11 | 2021-12-04 | Central | Jardine | Binder | 94 | 19.99 | 1879.06 | False |
The code above reads the second spreadsheet in the workbook, whose name is 2021. As mentioned before, we also can assign a sheet position number (zero-indexed) to the sheet_name argument. Let’s see how it works:
df = pd.read_excel('sales_data.xlsx', sheet_name=1)
display(df)| OrderDate | Region | Rep | Item | Units | Unit Cost | Total | Shipped | |
|---|---|---|---|---|---|---|---|---|
| 0 | 2021-01-15 | Central | Gill | Binder | 46 | 8.99 | 413.54 | True |
| 1 | 2021-02-01 | Central | Smith | Binder | 87 | 15.00 | 1305.00 | True |
| 2 | 2021-03-07 | West | Sorvino | Binder | 27 | 19.99 | 139.93 | True |
| 3 | 2021-04-10 | Central | Andrews | Pencil | 66 | 1.99 | 131.34 | False |
| 4 | 2021-05-14 | Central | Gill | Pencil | 53 | 1.29 | 68.37 | False |
| 5 | 2021-06-17 | Central | Tom | Desk | 15 | 125.00 | 625.00 | True |
| 6 | 2021-07-04 | East | Jones | Pen Set | 62 | 4.99 | 309.38 | True |
| 7 | 2021-08-07 | Central | Tom | Pen Set | 42 | 23.95 | 1005.90 | True |
| 8 | 2021-09-10 | Central | Gill | Pencil | 47 | 1.29 | 9.03 | True |
| 9 | 2021-10-14 | West | Thompson | Binder | 57 | 19.99 | 1139.43 | False |
| 10 | 2021-11-17 | Central | Jardine | Binder | 11 | 4.99 | 54.89 | False |
| 11 | 2021-12-04 | Central | Jardine | Binder | 94 | 19.99 | 1879.06 | False |
As you can see, both statements take in either the actual sheet name or sheet index to return the same result.
Sometimes, we want to import all the spreadsheets stored in an Excel file into pandas DataFrames simultaneously. The good news is that the read_excel() method provides this feature for us. In order to do this, we can assign a list of sheet names or their indices to the sheet_name argument. But there is a much easier way to do the same: to assign None to the sheet_name argument. Let’s try it:
all_sheets = pd.read_excel('sales_data.xlsx', sheet_name=None)Before exploring the data stored in the all_sheets variable, let’s check its data type:
type(all_sheets)dictAs you can see, the variable is a dictionary. Now, let’s reveal what is stored in this dictionary:
for key, value in all_sheets.items():
    print(key, type(value))
2020 <class 'pandas.core.frame.DataFrame'>
2021 <class 'pandas.core.frame.DataFrame'>The code above shows that the dictionary’s keys are the Excel workbook sheet names, and its values are pandas DataFrames for each spreadsheet. To print out the content of the dictionary, we can use the following code:
for key, value in all_sheets.items():
    print(key)
display(value)2020| OrderDate | Region | Rep | Item | Units | Unit Cost | Total | Shipped | |
|---|---|---|---|---|---|---|---|---|
| 0 | 2020-01-06 | East | Jones | Pencil | 95 | 1.99 | 189.05 | True |
| 1 | 2020-02-09 | Central | Jardine | Pencil | 36 | 4.99 | 179.64 | True |
| 2 | 2020-03-15 | West | Sorvino | Pencil | 56 | 2.99 | 167.44 | True |
| 3 | 2020-04-01 | East | Jones | Binder | 60 | 4.99 | 299.40 | False |
| 4 | 2020-05-05 | Central | Jardine | Pencil | 90 | 4.99 | 449.10 | True |
| 5 | 2020-06-08 | East | Jones | Binder | 60 | 8.99 | 539.40 | True |
| 6 | 2020-07-12 | East | Howard | Binder | 29 | 1.99 | 57.71 | False |
| 7 | 2020-08-15 | East | Jones | Pencil | 35 | 4.99 | 174.65 | True |
| 8 | 2020-09-01 | Central | Smith | Desk | 32 | 125.00 | 250.00 | True |
| 9 | 2020-10-05 | Central | Morgan | Binder | 28 | 8.99 | 251.72 | True |
| 10 | 2020-11-08 | East | Mike | Pen | 15 | 19.99 | 299.85 | False |
| 11 | 2020-12-12 | Central | Smith | Pencil | 67 | 1.29 | 86.43 | False |
2021| OrderDate | Region | Rep | Item | Units | Unit Cost | Total | Shipped | |
|---|---|---|---|---|---|---|---|---|
| 0 | 2021-01-15 | Central | Gill | Binder | 46 | 8.99 | 413.54 | True |
| 1 | 2021-02-01 | Central | Smith | Binder | 87 | 15.00 | 1305.00 | True |
| 2 | 2021-03-07 | West | Sorvino | Binder | 27 | 19.99 | 139.93 | True |
| 3 | 2021-04-10 | Central | Andrews | Pencil | 66 | 1.99 | 131.34 | False |
| 4 | 2021-05-14 | Central | Gill | Pencil | 53 | 1.29 | 68.37 | False |
| 5 | 2021-06-17 | Central | Tom | Desk | 15 | 125.00 | 625.00 | True |
| 6 | 2021-07-04 | East | Jones | Pen Set | 62 | 4.99 | 309.38 | True |
| 7 | 2021-08-07 | Central | Tom | Pen Set | 42 | 23.95 | 1005.90 | True |
| 8 | 2021-09-10 | Central | Gill | Pencil | 47 | 1.29 | 9.03 | True |
| 9 | 2021-10-14 | West | Thompson | Binder | 57 | 19.99 | 1139.43 | False |
| 10 | 2021-11-17 | Central | Jardine | Binder | 11 | 4.99 | 54.89 | False |
| 11 | 2021-12-04 | Central | Jardine | Binder | 94 | 19.99 | 1879.06 | False |
Combining Multiple Excel Spreadsheets into a Single Pandas DataFrame
Having one DataFrame per sheet allows us to have different columns or content in different sheets.
But what if we prefer to store all the spreadsheets’ data in a single DataFrame? In this tutorial, the workbook spreadsheets have the same columns, so we can combine them with the concat() method of pandas.
If you run the code below, you’ll see that the two DataFrames stored in the dictionary are concatenated:
combined_df = pd.concat(all_sheets.values(), ignore_index=True)
display(combined_df)| OrderDate | Region | Rep | Item | Units | Unit Cost | Total | Shipped | |
|---|---|---|---|---|---|---|---|---|
| 0 | 2020-01-06 | East | Jones | Pencil | 95 | 1.99 | 189.05 | True |
| 1 | 2020-02-09 | Central | Jardine | Pencil | 36 | 4.99 | 179.64 | True |
| 2 | 2020-03-15 | West | Sorvino | Pencil | 56 | 2.99 | 167.44 | True |
| 3 | 2020-04-01 | East | Jones | Binder | 60 | 4.99 | 299.40 | False |
| 4 | 2020-05-05 | Central | Jardine | Pencil | 90 | 4.99 | 449.10 | True |
| 5 | 2020-06-08 | East | Jones | Binder | 60 | 8.99 | 539.40 | True |
| 6 | 2020-07-12 | East | Howard | Binder | 29 | 1.99 | 57.71 | False |
| 7 | 2020-08-15 | East | Jones | Pencil | 35 | 4.99 | 174.65 | True |
| 8 | 2020-09-01 | Central | Smith | Desk | 32 | 125.00 | 250.00 | True |
| 9 | 2020-10-05 | Central | Morgan | Binder | 28 | 8.99 | 251.72 | True |
| 10 | 2020-11-08 | East | Mike | Pen | 15 | 19.99 | 299.85 | False |
| 11 | 2020-12-12 | Central | Smith | Pencil | 67 | 1.29 | 86.43 | False |
| 12 | 2021-01-15 | Central | Gill | Binder | 46 | 8.99 | 413.54 | True |
| 13 | 2021-02-01 | Central | Smith | Binder | 87 | 15.00 | 1305.00 | True |
| 14 | 2021-03-07 | West | Sorvino | Binder | 27 | 19.99 | 139.93 | True |
| 15 | 2021-04-10 | Central | Andrews | Pencil | 66 | 1.99 | 131.34 | False |
| 16 | 2021-05-14 | Central | Gill | Pencil | 53 | 1.29 | 68.37 | False |
| 17 | 2021-06-17 | Central | Tom | Desk | 15 | 125.00 | 625.00 | True |
| 18 | 2021-07-04 | East | Jones | Pen Set | 62 | 4.99 | 309.38 | True |
| 19 | 2021-08-07 | Central | Tom | Pen Set | 42 | 23.95 | 1005.90 | True |
| 20 | 2021-09-10 | Central | Gill | Pencil | 47 | 1.29 | 9.03 | True |
| 21 | 2021-10-14 | West | Thompson | Binder | 57 | 19.99 | 1139.43 | False |
| 22 | 2021-11-17 | Central | Jardine | Binder | 11 | 4.99 | 54.89 | False |
| 23 | 2021-12-04 | Central | Jardine | Binder | 94 | 19.99 | 1879.06 | False |
Now the data stored in the combined_df DataFrame is ready for further processing or visualization. In the following piece of code, we’re going to create a simple bar chart that shows the total sales amount made by each representative. Let’s run it and see the output plot:
total_sales_amount = combined_df.groupby('Rep').Total.sum()
total_sales_amount.plot.bar(figsize=(10, 6))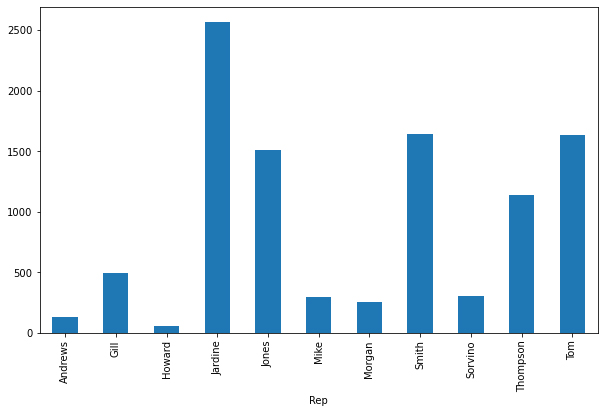
Reading Excel Files Using xlrd
Although importing data into a pandas DataFrame is much more common, another helpful package for reading Excel files in Python is xlrd. In this section, we’re going to scratch the surface of how to read Excel spreadsheets using this package.
NOTE
The xlrd package doesn’t support xlsx files due to a potential security vulnerability. So, we use the xls version of the sales data. You can download the xls version from the link below:
Sales Data Excel Workbook — xls ver.
Let’s see how it works:
import xlrd
excel_workbook = xlrd.open_workbook('sales_data.xls')
Above, the first line imports the xlrd package, then the open_workbook method reads the sales_data.xls file.
We can also open an individual sheet containing the actual data. There are two ways to do so: opening a sheet by index or by name. Let’s open the first sheet by index and the second one by name:
excel_worksheet_2020 = excel_workbook.sheet_by_index(0)
excel_worksheet_2021 = excel_workbook.sheet_by_name('2021')
Now, let’s see how we can print a cell value. The xlrd package provides a method called cell_value() that takes in two arguments: the cell’s row index and column index. Let’s explore it:
print(excel_worksheet_2020.cell_value(1, 3))PencilWe can see that the cell_value function returned the value of the cell at row index 1 (the 2nd row) and column index 3 (the 4th column).
The xlrd package provides two helpful properties: nrows and ncols, returning the number of nonempty spreadsheet’s rows and columns respectively:
print('Columns#:', excel_worksheet_2020.ncols)
print('Rows#:', excel_worksheet_2020.nrows)
Columns#: 8
Rows#: 13Knowing the number of nonempty rows and columns in a spreadsheet helps us with iterating over the data using nested for loops. This makes all the Excel sheet data accessible via the cell_value() method.
Conclusion
This tutorial discussed how to load Excel spreadsheets into pandas DataFrames, work with multiple Excel sheets, and combine them into a single pandas DataFrame. We also explored the main aspects of the xlrd package as one of the simplest tools for accessing the Excel spreadsheets data.